Kharif sowing has reached 658.19 lakh hectares as on 17 July 2026, which is 42.28 lakh hectares below the same date last year. Cumulative monsoon rainfall from 01 June to 19 July is 24 per cent below the long period average, reservoir storage stands at 34.46 per cent of live capacity, and mandi prices of most crops are ruling below MSP. This board tracks India’s official crop and weather data, updated every week.
Updated 22 July 2026 with the Crop Weather Watch Group (CWWG) report of 20 July 2026. Sowing and price data as on 17 July 2026; reservoir data as on 16 July 2026. New readings are added to this page every week.
Kharif sowing 2026: area by crop
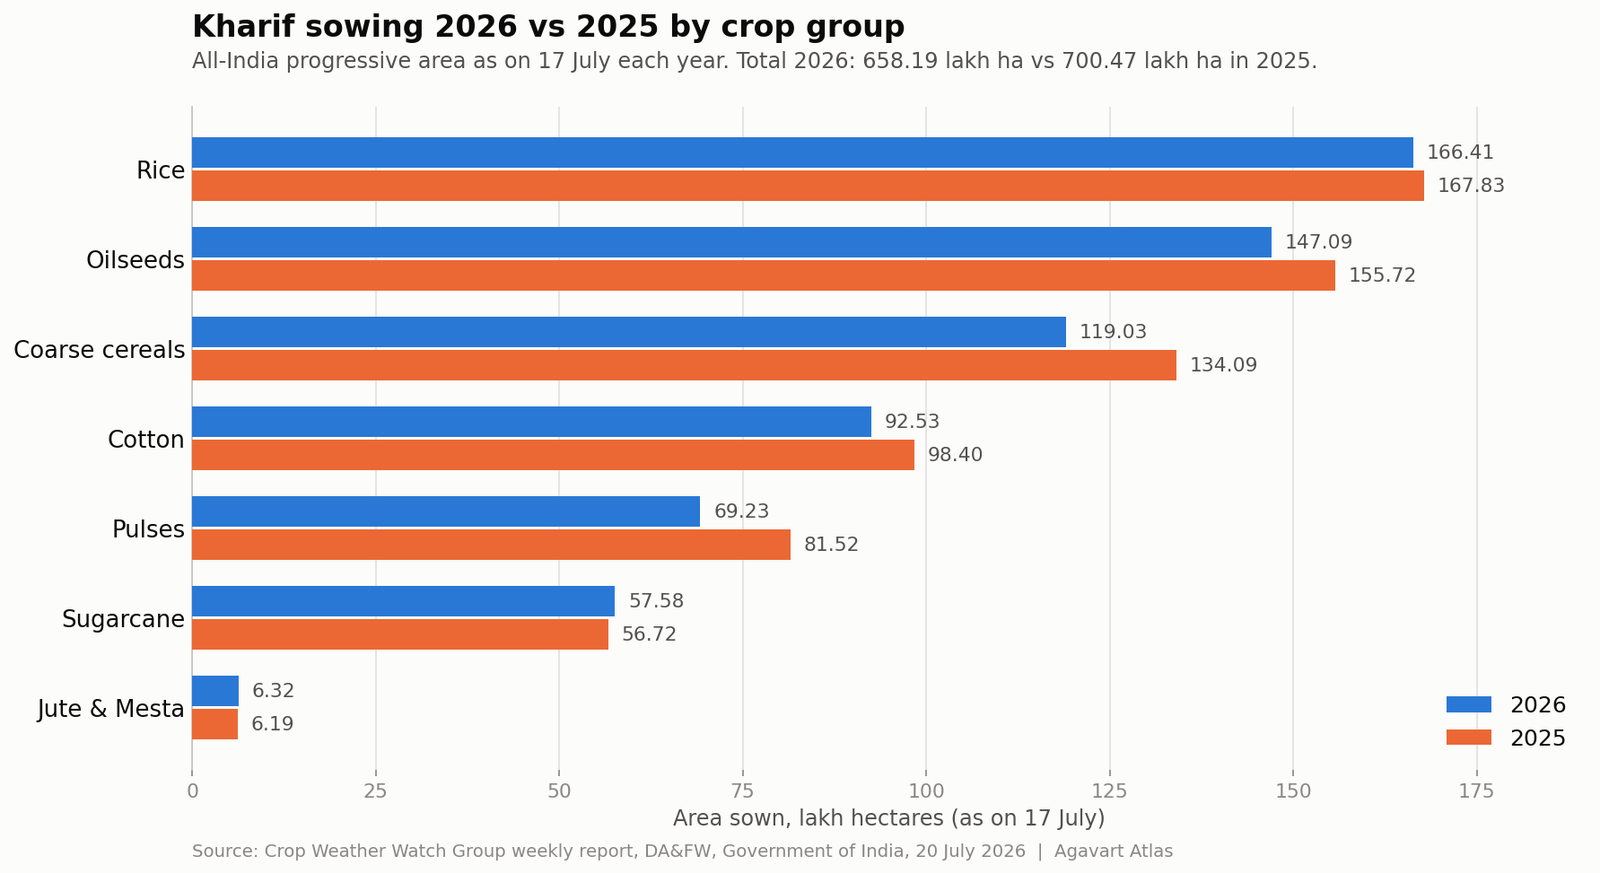
| Crop | Normal area (lakh ha) | Sown 2026 | Sown 2025 | Change |
|---|---|---|---|---|
| Rice | 412.00 | 166.41 | 167.83 | -1.41 |
| Pulses | 123.64 | 69.23 | 81.52 | -12.29 |
| Arhar | 44.32 | 24.80 | 30.17 | -5.36 |
| Moongbean | 35.48 | 23.98 | 26.94 | -2.97 |
| Urdbean | 29.60 | 13.51 | 14.36 | -0.85 |
| Shri Anna and coarse cereals | 182.63 | 119.03 | 134.09 | -15.06 |
| Maize | 80.77 | 67.89 | 71.50 | -3.61 |
| Bajra | 70.94 | 39.98 | 49.05 | -9.08 |
| Jowar | 14.44 | 8.74 | 9.99 | -1.25 |
| Oilseeds | 200.08 | 147.09 | 155.72 | -8.63 |
| Soybean | 128.71 | 106.02 | 111.05 | -5.02 |
| Groundnut | 46.79 | 34.52 | 37.69 | -3.17 |
| Sugarcane | 54.20 | 57.58 | 56.72 | 0.86 |
| Jute and Mesta | 6.40 | 6.32 | 6.19 | 0.13 |
| Cotton | 125.51 | 92.53 | 98.40 | -5.87 |
| Total kharif | 1104.46 | 658.19 | 700.47 | -42.28 |
The pulses shortfall is concentrated in Karnataka (down 5.76 lakh ha), Rajasthan (down 4.27 lakh ha) and Maharashtra (down 3.76 lakh ha). Coarse cereals are lower mainly in Rajasthan (down 8.87 lakh ha) and Karnataka (down 4.71 lakh ha), while Madhya Pradesh has added 3.56 lakh ha. In oilseeds, Maharashtra (down 5.70 lakh ha) and Gujarat (down 5.08 lakh ha) lead the decline, against a 3.31 lakh ha rise in Uttar Pradesh. For state-wise cotton detail, see the India Cotton Data Board.
Mandi prices vs MSP
| Commodity | MSP (Rs/qtl) | Price 17.07.26 | % vs week ago | % vs month ago | % vs year ago |
|---|---|---|---|---|---|
| Paddy (Common) | 2369 | 2713 | 11.76 | 16.77 | 29.05 |
| Wheat | 2585 | 2501 | 0.47 | 2.11 | -2.12 |
| Maize | 2400 | 1952 | 0.24 | 5.13 | -3.12 |
| Arhar whole | 8000 | 7504 | 3.88 | 2.32 | 9.65 |
| Chana (Gram) whole | 5875 | 5744 | 2.67 | 2.70 | -0.91 |
| Masur whole | 7000 | 7239 | 0.79 | 2.28 | 7.60 |
| Moong whole | 8768 | 6846 | 3.37 | -1.83 | -3.17 |
| Urad whole | 7800 | 9209 | 8.05 | 2.99 | 40.29 |
| Jowar | 3699 | 3928 | -8.42 | 3.36 | 25.05 |
| Bajra | 2775 | 2158 | -7.91 | -2.28 | -3.90 |
| Ragi | 4886 | 3345 | 1.45 | -3.97 | -4.15 |
| Groundnut | 7263 | 7132 | 0.32 | -2.60 | 33.60 |
| Mustard | 6200 | 7247 | 0.04 | -0.97 | 8.55 |
| Soyabean | 5328 | 7176 | 6.97 | 11.39 | 70.21 |
| Sesamum | 9846 | 11500 | -8.81 | -3.50 | 20.58 |
| Sunflower | 7721 | 6998 | -9.07 | -9.29 | Not available |
| Onion | No MSP | 1994 | 1.94 | 30.26 | 60.49 |
| Potato | No MSP | 801 | -1.76 | 2.53 | -32.46 |
| Tomato | No MSP | 1841 | -1.28 | -21.37 | -13.52 |
The report notes that mandi wholesale prices of all crops this week are running below MSP except paddy, masur, urad, jowar, mustard, soyabean and sesamum. The deepest gaps below MSP are in ragi (31.54 per cent below), bajra (22.23 per cent below), moong (21.92 per cent below) and maize (18.67 per cent below).
Retail prices
| Commodity | Price 17.07.26 (Rs/kg) | % vs week ago | % vs month ago | % vs year ago |
|---|---|---|---|---|
| Rice | 44.56 | 0.41 | 2.18 | 3.87 |
| Wheat | 31.28 | 0.03 | 0.71 | 0.06 |
| Arhar/Tur dal | 123.11 | 0.18 | 0.30 | 2.28 |
| Chana (Gram) dal | 86.14 | 0.05 | 0.37 | -0.08 |
| Masur dal | 90.34 | -0.03 | 0.27 | 1.99 |
| Moong dal | 111.70 | 0.28 | -0.09 | 0.69 |
| Urad dal | 120.19 | 0.51 | 1.11 | 4.02 |
| Jowar | 44.43 | -0.07 | -0.47 | 3.83 |
| Bajra | 38.25 | -0.23 | -0.57 | 1.73 |
| Ragi | 55.22 | 0.11 | 0.64 | 3.29 |
| Mustard oil | 194.52 | 0.40 | 1.13 | 9.21 |
| Soyabean oil | 163.69 | 0.38 | 0.66 | 11.53 |
| Onion | 34.53 | 3.97 | 26.44 | 22.58 |
| Potato | 22.78 | 0.09 | 3.97 | -12.55 |
| Tomato | 41.45 | -1.75 | -7.17 | 0.34 |
Monsoon, reservoirs and soil moisture
| Rainfall reading | Departure from LPA |
|---|---|
| Week of 09 to 15 July 2026 | -51% |
| Cumulative, 01 June to 15 July 2026 | -23% |
| Cumulative, 01 June to 19 July 2026 | -24% |
| East and Northeast India (01 June to 19 July) | -35% |
| Northwest India (01 June to 19 July) | -23% |
| Central India (01 June to 19 July) | -14% |
| South Peninsula (01 June to 19 July) | -27% |
The southwest monsoon covered the entire country on 09 July 2026, one day after the normal date of 08 July. IMD expects rainfall to be near normal to above normal over parts of East and Central India during the coming week and below normal over the remaining parts of the country.
As on 16 July 2026, live storage in the 166 major reservoirs monitored by the Central Water Commission was 63.249 billion cubic metres, which is 34.46 per cent of total live capacity of 183.565 BCM. This is 60.84 per cent of last year’s storage on the same date and 98.17 per cent of the ten year average. Of the 166 reservoirs, 109 hold more than 80 per cent of normal storage, 40 hold 51 to 80 per cent, and 17 hold up to 50 per cent.
Satellite based root zone soil moisture for 10 to 16 July was similar to the ten year average in major parts of western Madhya Pradesh, western Maharashtra, western Uttar Pradesh, Gujarat, central Chhattisgarh and Odisha, Jammu and Kashmir and Kerala. It was lower than average in northern and southern Chhattisgarh, Jharkhand, Bihar, Punjab, Haryana, Kutch and western Gujarat, Marathwada, central and eastern Karnataka, Andhra Pradesh, Telangana, eastern West Bengal and northeastern pockets. Groundwater remains largely stable: 87.8 per cent of the 9,085 monitored wells fall in the normal category.
Fertilizers and crop protection
| Product | Kharif 2026 requirement | July requirement | Availability | Sales | Closing stock |
|---|---|---|---|---|---|
| Urea | 190.32 | 41.67 | 160.20 | 90.92 | 69.29 |
| DAP | 56.23 | 12.00 | 38.38 | 21.99 | 16.39 |
| MOP | 17.57 | 3.54 | 13.69 | 5.04 | 8.65 |
| NPK complex | 84.99 | 17.07 | 83.26 | 38.14 | 45.12 |
| SSP | 34.81 | 6.69 | 38.81 | 17.19 | 21.62 |
| Total | 383.92 | 80.96 | 334.35 | 173.28 | 161.07 |
The report describes fertilizer availability as comfortable, with the DAP opening stock for kharif 2026 higher by 11.78 lakh tonnes than last year. Pest and disease intensity remained below the economic threshold level overall, with two exceptions under advisory: semilooper in jute in Morigaon, Assam, and fall army worm in maize in Kangra, Himachal Pradesh.
Food inflation
| Measure | June 2026 | May 2026 |
|---|---|---|
| WPI inflation (all commodities) | 9.87% | 9.68% |
| WPI food index inflation | 6.14% | 4.49% |
| CPI inflation | 4.38% | 3.93% |
| Consumer food price index (CFPI) inflation | 5.32% | 4.78% |
Procurement and stocks
Rice procurement in KMS 2025-26 stands at 561.41 lakh tonnes in rice terms, 98.92 per cent of the estimate, against 532.32 lakh tonnes in the corresponding period of KMS 2024-25. Wheat procurement in RMS 2026-27 stands at 357.57 lakh tonnes against 299.52 lakh tonnes last season. Central pool stocks on 01 July 2026 were 403.11 lakh tonnes of rice against a buffer norm of 135.4, and 522.74 lakh tonnes of wheat against a norm of 275.8.
Week by week tracker
| Data as on | Kharif area (lakh ha) | Change vs last year | Cumulative rainfall vs LPA | Reservoir storage (% of capacity) |
|---|---|---|---|---|
| 17 July 2026 | 658.19 | -42.28 | -24% | 34.46% |
What this week’s data says
The Crop Weather Watch Group is an inter departmental body of the Ministry of Agriculture and Farmers Welfare that meets every week during the crop season and pools data from IMD, the Central Water Commission, the Department of Fertilizers, state agriculture departments, Agmarknet, the Department of Consumer Affairs and FCI. Its weekly minutes are the closest thing India has to a single official dashboard of the farm season, but they are published only as a PDF. This board restructures that PDF into open tables and keeps a running series.
The picture as of 17 July is of a season running late and dry. Total kharif area is 6 per cent below last year, and the shortfall is not evenly spread. Rice is nearly flat, sugarcane is marginally ahead, but pulses are down 12.29 lakh hectares and coarse cereals 15.06 lakh hectares. The geography explains why: the sowing gap sits in Karnataka, Rajasthan and Maharashtra, the same belt where cumulative rainfall and soil moisture are running short. Where rain has been closer to normal, in Madhya Pradesh and Uttar Pradesh, area has actually grown.
Prices are telling the same story from the demand side. Soyabean at Rs 7,176 per quintal is 70.21 per cent above last year and well over MSP, and urad, arhar and masur are also ruling firm, a direct read on this season’s oilseed and pulses risk. On the other side, maize, bajra, ragi and moong are far below MSP even before the new crop arrives. Onion at the retail level is up 26.44 per cent in a month, worth watching into August. The inflation data confirms the turn: WPI food inflation jumped from 4.49 to 6.14 per cent in June and the CFPI from 4.78 to 5.32 per cent.
What next: IMD expects active monsoon conditions over northwest, east and northeast India in the coming week, with subdued rainfall over west central and south peninsular India for another seven days. That would help paddy transplanting in the north but keeps the pressure on the pulses and oilseeds belt of the peninsula. Reservoir storage at 61 per cent of last year is the number to track for the rabi season ahead. The next CWWG reading lands here within a week of release.
Frequently asked questions
What is the Crop Weather Watch Group?
The CWWG is an inter departmental group under the Department of Agriculture and Farmers Welfare that meets weekly to review rainfall, sowing, inputs, pests, prices and procurement, and publishes its minutes as a weekly report.
How much kharif area has been sown in 2026 so far?
As on 17 July 2026, 658.19 lakh hectares were sown against 700.47 lakh hectares on the same date last year, a gap of 42.28 lakh hectares.
Why is kharif sowing lower in 2026?
Cumulative rainfall to 19 July is 24 per cent below the long period average, with the largest deficits over East and Northeast India and the south peninsula. The sowing shortfall is concentrated in pulses, coarse cereals and oilseeds in Karnataka, Rajasthan and Maharashtra.
Is the 2026 monsoon normal?
The monsoon covered the whole country on 09 July, one day after the normal date, but cumulative rainfall from 01 June to 19 July is 24 per cent below the long period average, so coverage is complete while quantity is deficient.
Which crops are trading below MSP?
Per the report, all crops except paddy, masur, urad, jowar, mustard, soyabean and sesamum are below MSP this week. The deepest gaps are in ragi, bajra, moong and maize.
Source
Weekly report and minutes of the Crop Weather Watch Group meeting held on 20 July 2026, Department of Agriculture and Farmers Welfare, Ministry of Agriculture and Farmers Welfare, Government of India, published on the DA&FW CWWG minutes page. Underlying data: IMD, Central Water Commission, Department of Fertilizers, Agmarknet, Department of Consumer Affairs and FCI, as compiled in that report. Where the source is internally inconsistent, figures are carried as printed with the reading window stated.
Cite this page as: Agavart Atlas, India Crop Weather Data Board, updated 22 July 2026, agavart.com/india-crop-weather-data-board/
Curated and Reviewed by Deepak Chavan.