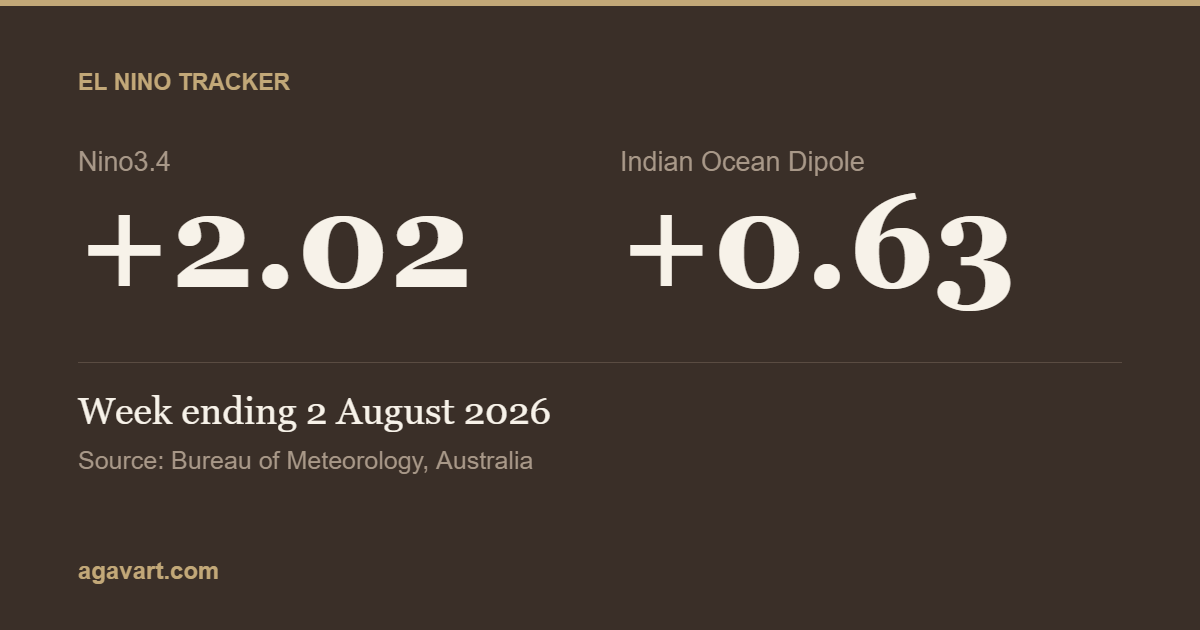
In the week ending 2 August 2026, the Pacific Nino3.4 index reached +2.02 degrees Celsius, its highest reading this year. The Indian Ocean Dipole stood at +0.63, a second consecutive week above the Bureau of Meteorology’s +0.4 positive dipole level. Both indexes have risen since early June.
Reading for the week ending 2 August 2026.
Bureau of Meteorology, Australia
Bureau of Meteorology, Australia
Every week of 2026 so far
Dashed lines mark the levels the Bureau of Meteorology treats as El Nino and as a positive Indian Ocean Dipole.
What these two numbers actually mean
The Nino3.4 index
Scientists have drawn a fixed rectangle on the map of the central Pacific Ocean. Every week they measure how warm the sea surface inside that rectangle is, and compare it with the normal temperature for that time of year. The difference, in degrees Celsius, is the Nino3.4 index.
A positive number means that part of the Pacific is warmer than normal. The Bureau of Meteorology treats sustained monthly values above +0.8 degrees as typical of El Nino. Values below minus 0.8 degrees are typical of La Nina. Anything in between is called neutral.
The Indian Ocean Dipole
This one compares two ends of the Indian Ocean. It measures how much warmer the western side, near Africa, is than the eastern side, near Indonesia. That difference is the Indian Ocean Dipole, again in degrees Celsius.
The Bureau of Meteorology treats sustained values above +0.4 degrees as a positive Indian Ocean Dipole, and values below minus 0.4 degrees as a negative one.
Where the numbers stand against the official levels
| Index | Level | What the Bureau of Meteorology calls it |
|---|---|---|
| Nino3.4 | +0.8 and above | El Nino conditions |
| Nino3.4 | between minus 0.8 and +0.8 | Neutral |
| Nino3.4 | minus 0.8 and below | La Nina conditions |
| Indian Ocean Dipole | +0.4 and above | Positive dipole |
| Indian Ocean Dipole | minus 0.4 and below | Negative dipole |
These levels are the Bureau’s own stated criteria. A single week above a level is not enough. The Bureau looks for values that stay there.
Week by week, 2026
| Week ending | Nino3.4 | Indian Ocean Dipole |
|---|---|---|
| 2 August 2026 | +2.02 | +0.63 |
| 26 July 2026 | +1.94 | +0.44 |
| 19 July 2026 | +1.74 | +0.25 |
| 12 July 2026 | +1.47 | -0.06 |
| 5 July 2026 | +1.25 | -0.16 |
| 28 June 2026 | +1.24 | -0.03 |
| 21 June 2026 | +1.11 | +0.01 |
| 14 June 2026 | +0.92 | -0.13 |
| 7 June 2026 | +0.81 | -0.34 |
| 31 May 2026 | +0.69 | -0.43 |
| 24 May 2026 | +0.67 | -0.34 |
| 17 May 2026 | +0.68 | -0.16 |
| 10 May 2026 | +0.52 | -0.04 |
| 3 May 2026 | +0.39 | +0.01 |
| 26 April 2026 | +0.23 | +0.09 |
| 19 April 2026 | -0.06 | +0.01 |
| 12 April 2026 | -0.27 | +0.06 |
| 5 April 2026 | -0.35 | -0.14 |
| 29 March 2026 | -0.42 | -0.25 |
| 22 March 2026 | -0.51 | -0.13 |
| 15 March 2026 | -0.53 | +0.53 |
| 8 March 2026 | -0.62 | +0.86 |
| 1 March 2026 | -0.67 | +0.69 |
| 22 February 2026 | -0.58 | +0.63 |
| 15 February 2026 | -0.77 | +0.53 |
| 8 February 2026 | -0.87 | +0.46 |
| 1 February 2026 | -0.75 | +0.59 |
| 25 January 2026 | -0.79 | +0.45 |
| 18 January 2026 | -0.91 | -0.04 |
| 11 January 2026 | -0.90 | -0.01 |
| 4 January 2026 | -0.95 | +0.18 |
All 31 weeks read directly from the Bureau of Meteorology data files. Newest week first.
When the next readings are due
The Bureau of Meteorology publishes a new weekly reading every Tuesday. The next detailed discussion from the United States climate agency NOAA is due on 13 August 2026.
Latest reading: week ending 2 August 2026. Checked against the Bureau of Meteorology files on 6 August 2026, 06:15 IST.
Questions readers ask
What is the latest Indian Ocean Dipole reading?
The Indian Ocean Dipole stands at +0.63 for the week ending 2 August 2026, up 0.19 on the previous week. The Bureau of Meteorology treats sustained values above +0.4 as a positive dipole.
What is the Nino3.4 index right now?
The Nino3.4 index stands at +2.02 for the week ending 2 August 2026, up 0.08 on the previous week. It is the highest reading of 2026 so far.
Is El Nino under way in 2026?
Nino3.4 has been at or above the +0.8 level for 9 straight weeks, from the week ending 7 June 2026. The Bureau of Meteorology does not call El Nino on a single week. It looks for values that stay above the level, and its own advisory is where that decision is announced.
When are new readings published?
The Bureau of Meteorology publishes a new weekly reading every Tuesday, and this page picks it up automatically. The last successful check was 6 August 2026 at 06:15 IST.
Where do these numbers come from?
Every figure on this page is read directly from the Bureau of Meteorology weekly data files for Nino3.4 and the Indian Ocean Dipole. Nothing is estimated, averaged or adjusted by Agavart.
Sources
- Nino3.4 weekly index and Indian Ocean Dipole weekly index, Bureau of Meteorology, Australia: bom.gov.au/climate/enso
- ENSO Diagnostic Discussion, NOAA Climate Prediction Center: cpc.ncep.noaa.gov
Cite this page
El Nino Tracker. Readings sourced from the Bureau of Meteorology, Australia. Retrieved from agavart.com/el-nino-tracker/