Published 25 July 2026, 1:30 PM IST | Pune
India’s petrol is getting greener partly because there is less petrol. The US Department of Agriculture’s Foreign Agricultural Service projects India’s fuel ethanol blend rate at 23.4 per cent in calendar 2026, up from 20.0 per cent in 2025. In the same forecast, India’s gasoline pool contracts by about 8 per cent, from 52.5 billion litres to 48.3 billion litres. Fuel ethanol volumes rise 8 per cent, from 10.48 billion litres to 11.31 billion litres. Both movements push the ratio up together.
Primary source India Biofuels Annual 2026, USDA Foreign Agricultural Service GAIN Report IN2026-0039 Post: New Delhi. Prepared by Shilpita Das, approved by Karen Richards. Released 23 July 2026. 30 pages. Public distribution. Figures below are the report’s own, presented in the units it uses.
India fuel ethanol blend rate, 2017 to 2026 forecast
Per cent of the gasoline pool. 2026 is a FAS New Delhi projection.
Under 10 per cent10 to 20 per centForecast 2026Source: USDA FAS GAIN IN2026-0039, Table 7.
The blend rate is a ratio, and this year both halves of it moved. Read on for the full breakdown, the feedstock tables and the sources.
The denominator nobody is talking about
Almost every account of India’s ethanol programme measures success by the blend rate. The blend rate is fuel ethanol divided by the gasoline pool, and in 2026 the report projects movement in both. Ethanol volumes are rising. The pool they are blended into is shrinking. The table below sets the two side by side for five years so the arithmetic is visible rather than assumed.
Board 1. What the blend rate is actually made of
| Calendar year | Fuel ethanol use (million litres) | Gasoline pool (million litres) | Blend rate |
|---|---|---|---|
| 2022 | 3,700 | 41,831 | 8.8% |
| 2023 | 5,200 | 45,427 | 11.4% |
| 2024 | 6,400 | 48,400 | 13.2% |
| 2025 | 10,480 | 52,500 | 20.0% |
| 2026 forecast | 11,310 | 48,260 | 23.4% |
Source: USDA FAS GAIN IN2026-0039, Table 7, Market Penetration rows. The gasoline pool figure includes blended ethanol and all additives. FAS derives pool estimates from the Ministry of Petroleum and Natural Gas PPAC monthly consumption data.
Grain has taken over from sugarcane
The second structural shift in the report is in what the ethanol is made from. Grain feedstocks now supply 73 per cent of total ethanol, with corn alone at 46 per cent and Food Corporation of India rice at 22 per cent. Sugarcane feedstocks supply the remaining 27 per cent. A year earlier corn was at 47 per cent and FCI rice at just 15 per cent. The volumes behind those shares are large enough to matter to grain balance sheets, not only to fuel policy.
Grain moving into fuel ethanol, 2024 to 2026 forecast
Feedstock use for fuel ethanol, thousand metric tonnes.
Source: USDA FAS GAIN IN2026-0039, Table 7, Feedstock Use for Fuel Ethanol, corn kernel and rice rows. The 2024 rice bar is drawn at a minimum visible width; the actual figure is 3 thousand tonnes. The report separately notes that the Food Corporation of India allocated 5.2 MMT of rice for ethanol, against 2.3 MMT the previous year.
Board 2. Feedstock use for fuel ethanol, thousand metric tonnes
| Feedstock | 2023 | 2024 | 2025 | 2026 forecast |
|---|---|---|---|---|
| Sugarcane syrup | 15,000 | 3,539 | 20,717 | 23,138 |
| Corn kernel | 32 | 7,961 | 12,931 | 13,684 |
| Rice | 1,890 | 3 | 3,592 | 5,682 |
| Molasses, B heavy | 9,250 | 5,060 | 4,591 | 4,014 |
| Damaged food grains | 2,100 | 4,064 | 3,132 | 2,120 |
| Molasses, C heavy | 600 | 2,701 | 795 | 650 |
Source: USDA FAS GAIN IN2026-0039, Table 7. Rows ordered by 2026 forecast volume. Tonnage does not translate into equal volumes of ethanol; the conversion rates given in the report are corn 380 litres per tonne, broken rice 440, damaged food grains 250, B heavy molasses 300, C heavy molasses 217 and sugarcane juice 76. Rice use in 2024 was effectively nil at 3 thousand tonnes.
The price signal that moved the crop
The feedstock shift was engineered through procurement pricing. The Cabinet Committee on Economic Affairs sets a separate ethanol price for each feedstock, and corn ethanol carries the highest price of the six. The report states that the government deliberately set corn ethanol above other feedstocks to encourage corn usage and diversify the feedstock base, and that average corn prices moved from INR 14,500 per tonne in 2023 to INR 25,500 per tonne in 2026. It also records that ethanol incentives in 2025 prompted farmers to shift acreage from soybeans and pulses to corn.
Board 3. Ethanol procurement price by feedstock, INR per litre
| Feedstock | ESY 2022/23 | ESY 2023/24 | ESY 2024/25 | ESY 2025/26 |
|---|---|---|---|---|
| Corn | Not listed | 66.00 | 71.86 | 71.86 |
| Sugarcane juice, syrup or sugar | 65.61 | 65.61 | 65.61 | 65.61 |
| Damaged food grains | 55.54 | 64.00 | 64.00 | 64.00 |
| Molasses, B heavy | 60.73 | 60.73 | 60.73 | 60.73 |
| Surplus rice, Food Corporation of India | 58.50 | 58.50 | 58.50 | 60.32 |
| Molasses, C heavy | 49.41 | 56.28 | 57.97 | 57.97 |
Source: USDA FAS GAIN IN2026-0039, Table 4, sourced to the Ministry of Petroleum and Natural Gas. ESY is the Ethanol Supply Year. Rows ordered by the ESY 2025/26 price. The corn entry for ESY 2022/23 is shown as a dash in the original table.
Capacity has run ahead of demand
India built the plants faster than it built the offtake. Nameplate ethanol capacity has gone from 2.2 billion litres in 2017 to 22.0 billion litres in the 2026 forecast, across more than 1,300 refineries. Capacity utilisation in 2026 is projected at 51.5 per cent. The report notes that during the first six months of ESY 2025/26 about 51 per cent of ethanol demand was fulfilled, and that oil marketing companies may not proceed with an anticipated additional 2 billion litre tender in August 2026 if gasoline demand falls further.
Board 4. Ethanol capacity against capacity used
| Calendar year | Refineries | Nameplate capacity (million litres) | Capacity use |
|---|---|---|---|
| 2021 | 231 | 4,300 | 69.8% |
| 2022 | 252 | 5,700 | 64.0% |
| 2023 | 263 | 10,820 | 48.6% |
| 2024 | 270 | 16,150 | 40.1% |
| 2025 | 1,212 | 17,000 | 61.2% |
| 2026 forecast | 1,300 | 22,000 | 51.5% |
Source: USDA FAS GAIN IN2026-0039, Table 7, Refineries Producing Fuel Ethanol. Capacity use is the report’s own calculation. The refinery count in the table moves from 270 in 2024 to 1,212 in 2025, which the report does not separately explain.
Biodiesel is the part that has not worked
Ethanol gets the headlines. Biodiesel is where the report is blunt. India targets a 5 per cent biodiesel blend for on road transport by 2030, which the report puts at roughly 4.5 billion litres a year. The projected 2026 blend rate is 0.63 per cent. Consumption is growing quickly in percentage terms, up 18 per cent to 560 million litres, but from a base so small that the growth does not close the gap. Feedstock, not policy, is the binding constraint.
Board 5. Biodiesel, the gap between ambition and supply
| Measure | 2024 | 2025 | 2026 forecast |
|---|---|---|---|
| Production (million litres) | 358 | 556 | 640 |
| Consumption (million litres) | 360 | 475 | 560 |
| Exports (million litres) | 0 | 76 | 110 |
| Nameplate capacity (million litres) | 1,020 | 1,200 | 2,000 |
| Capacity use | 35.1% | 46.3% | 32% |
| Used cooking oil as feedstock (thousand tonnes) | 180 | 437 | 515 |
| Palm stearin and other (thousand tonnes) | 150 | 90 | 88 |
| Blend rate | 0.5% | 0.6% | 0.63% |
Source: USDA FAS GAIN IN2026-0039, Table 9. The on road diesel pool for 2026 is projected at 81,562 million litres and the total diesel pool at 101,952 million litres. India consumes roughly 24 billion litres of cooking oil a year, of which the report estimates about 6 per cent is improperly reused; fully captured, that recycled oil could theoretically yield about 1.3 billion litres of biodiesel.
Aviation and shipping are the next mandates
The report sets out a third tier of the programme that is still small in volume but firm in schedule. Sustainable aviation fuel blending targets for international flights are 1 per cent by 2027, 2 per cent by 2028 and 5 per cent by 2030, aligned to the CORSIA framework. On 23 April 2026 the Ministry of Petroleum and Natural Gas brought aviation turbine fuel blended with SAF under the ATF Control Order, which previously covered only petroleum based fuel.
Board 6. Advanced biofuels, where India stands
| Stream | Target | Capacity today | Constraint named in the report |
|---|---|---|---|
| Sustainable aviation fuel | 1% by 2027, 2% by 2028, 5% by 2030, international flights | 30,000 tonnes a year at the IOCL Panipat refinery, India’s first CORSIA certification received December 2025 | SAF costs 3 to 5 times conventional jet fuel; high capital cost for production facilities |
| Second generation ethanol | 5 to 10 billion litres by 2030 under the 2018 National Biofuels Policy | 32 million litres a year across pilot and demonstration plants; 12 commercial bio refineries under development | Biomass collection and aggregation; capital cost per megawatt above solar or wind |
| Sustainable marine fuel | Support deep sea dual fuel vessels on the Asia to Europe corridor | Kandla Port rated Level 6 on the IAPH Port Readiness Level scale; trial shore to ship methanol bunkering on 2 April 2026 | Working towards about 500,000 tonnes of RFNBO compliant e methanol by 2028/29 |
| Compressed biogas | Over 1,000 additional plants planned nationwide under SATAT | 126 operational plants producing about 860 tonnes a day; 82 more under construction adding 660 tonnes a day | Feedstock aggregation and limited year round storage infrastructure |
Source: USDA FAS GAIN IN2026-0039, Sections II and V and Table 10. Financial allocations recorded for second generation ethanol: INR 18 billion for 12 integrated bioethanol projects, INR 1.5 billion for 10 demonstration plants and INR 195 million for a Centre for High Technology, with oil marketing companies investing INR 140 billion in 12 second generation bio refineries.
Trade stays closed
India prohibits imports of fuel ethanol and biodiesel intended for blending with domestic fuel supplies. Ethanol continues to be imported for medical, industrial and beverage use, and that stream is now shrinking as domestic industrial capacity expands and freight and United States prices rise. Undenatured ethanol at 80 per cent strength or above carries a 150 per cent import duty. On molasses, the 50 per cent export duty imposed in January 2024 remains in force; before that duty India was among the world’s largest molasses exporters.
Board 7. Ethanol and biodiesel trade, million litres
| Flow | 2024 | 2025 | 2026 forecast |
|---|---|---|---|
| Ethanol imports, industrial and other non fuel | 777 | 792 | 560 |
| Ethanol exports | 89 | 52 | 100 |
| Fuel ethanol imports and exports | 0 | 0 | 0 |
| Biodiesel imports | 0 | 0 | 0 |
| Biodiesel exports | 0 | 76 | 110 |
Source: USDA FAS GAIN IN2026-0039, Tables 7 and 9. Congo, Tanzania and Kenya are named as the primary destinations for ethanol exports. Biodiesel exports are forecast higher on European Union demand offsetting lower imports from Argentina. Between January and March 2026 India imported 169 million litres of industrial ethanol from the United States, 19 per cent below the same period in 2025.
Where the report’s own figures differ
Agavart reads the tables and the narrative against each other before citing either. Three places in this report do not reconcile, and anyone quoting the document should know which number they are using.
| Item | Narrative text says | Table says |
|---|---|---|
| Ethanol imports, 2025 | 858 million litres, a decline of about 35 per cent to 560 million litres in 2026 (Section III.C) | 792 million litres (Table 7) |
| Ethanol exports, 2025 | 53 million litres (Section III.C) | 52 million litres (Table 7) |
| Ethanol converted from surplus FCI rice, 2026 | 5,682 thousand tonnes of rice used for fuel ethanol (Table 7) | 0.0013 billion litres of ethanol from that rice (Table 8), against a stated conversion rate of 440 litres per tonne |
| Feedstock share wording | Executive summary: grain 73 per cent, corn 46 per cent, damaged grains and government rice stocks 27 per cent | Section III: grain 73 per cent, corn 46 per cent, FCI rice 22 per cent, sugarcane the remaining 27 per cent |
Agavart uses the detailed section and table figures throughout this page, and states the alternative wherever one exists. No figure on this page has been adjusted, recalculated or rounded beyond the report’s own presentation.
Why the blend rate rose faster than the ethanol volume
A blending mandate is a ratio, and a ratio can move for two reasons. Between 2025 and 2026 the fuel ethanol volume in this forecast rises from 10,480 to 11,310 million litres. Over the same period the gasoline pool it is blended into falls from 52,500 to 48,260 million litres. The report treats the second movement as a real constraint rather than a statistical quirk, listing electric vehicle uptake, compressed natural gas infrastructure, elevated crude prices and West Asia supply disruption as its causes. It then states plainly that as gasoline consumption falls, higher blend rates are required to maintain or grow ethanol volumes. That is a different mechanism from the one the headline percentage suggests.
What 73 per cent grain feedstock means for Indian agriculture
For anyone working in grain markets, this is the more consequential half of the report. Corn use for fuel ethanol is projected at 13.68 million tonnes in 2026, and rice at 5.68 million tonnes. The Food Corporation of India allocation for ethanol went from 2.3 million tonnes to 5.2 million tonnes in a single year. The report records that ethanol incentives prompted farmers to shift acreage away from soybeans and pulses towards corn, and that average corn prices moved from INR 14,500 per tonne to INR 25,500 per tonne between 2023 and 2026. It also notes that the decision to divert food grains to industrial use has drawn concern. The report’s own caution is that concentrating on three primary crops is itself a risk when weather turns erratic.
Why biodiesel stalled while ethanol succeeded
Ethanol had a feedstock the country already grew in surplus and a pricing mechanism that could redirect it. Biodiesel has neither. Used cooking oil is the principal feedstock, and its supply depends on collection logistics that do not yet exist at scale, and on edible oil consumption that is itself falling. The report projects a modest rise in used cooking oil availability to 515,000 tonnes, palm stearin below historical levels because of reduced Indonesian exports, and animal fats at 10,000 tonnes. Installed capacity has doubled to 2 billion litres while utilisation falls to 32 per cent. Reaching 5 per cent by 2030 would need about 5 billion litres against 640 million litres of projected production, close to ten times the current level.
What to watch next
Three things decide whether the 2026 forecast holds. First, whether oil marketing companies proceed with the additional 2 billion litre ethanol tender expected in August 2026, which the report says may be dropped if gasoline demand weakens further. Second, whether the isobutanol blending requirement that industry expects by the end of 2026 is actually notified, since that is the only route in this report large enough to move the diesel pool. Third, the sugarcane crop: India banned sugar exports with immediate effect on 13 May 2026 until September 2026 after production fell below expectations, and the report flags fertiliser supply constraints stemming from the West Asia conflict as a risk to the 2026/27 cane crop. Total sugar production for marketing year 2026/27 is projected at 33.6 million tonnes, of which about 3.5 million tonnes is expected to go to ethanol.
Questions readers ask about this report
What is India’s ethanol blending rate in 2026?
USDA FAS New Delhi projects a 23.4 per cent fuel ethanol blend rate for calendar 2026, up from 20.0 per cent in 2025. India reached its E20 target in May 2025, and E20 petrol with a minimum 95 Research Octane Number became the mandatory national standard from 1 April 2026 following a 17 February 2026 directive from the Ministry of Petroleum and Natural Gas.
Why is India’s blend rate rising if petrol demand is falling?
Both are true at once, and they reinforce each other. The blend rate is fuel ethanol divided by the gasoline pool. The report projects fuel ethanol rising from 10.48 to 11.31 billion litres while the gasoline pool contracts about 8 per cent from 52.5 to 48.3 billion litres. It states that as gasoline consumption decreases, higher ethanol blend rates are required to maintain or grow overall ethanol volumes.
Which feedstock supplies most of India’s ethanol?
Corn. Grain feedstocks supply 73 per cent of total ethanol supplies, with corn at 46 per cent and Food Corporation of India rice at 22 per cent. Sugarcane feedstocks supply the remaining 27 per cent. A year earlier corn stood at 47 per cent and FCI rice at 15 per cent.
How much corn and rice does India use for ethanol?
The report projects 13.68 million tonnes of corn and 5.68 million tonnes of rice used as fuel ethanol feedstock in 2026. The Food Corporation of India allocated 5.2 million tonnes of rice for ethanol, against 2.3 million tonnes the previous year.
Why is India’s biodiesel blending only 0.63 per cent?
Feedstock availability, not policy. Used cooking oil is the principal feedstock and collection remains logistically difficult, while falling edible oil consumption limits how much becomes available. Installed biodiesel capacity is 2 billion litres with utilisation projected at 32 per cent. The 5 per cent target for 2030 would require about 4.5 to 5 billion litres a year.
What is isobutanol and why is India considering it?
Isobutanol is a diesel substitute fermented from natural sugars using a process similar to ethanol manufacture. It has higher energy density than ethanol and blends directly with diesel without additives. The Ministry of Road Transport and Highways set out the shift on 29 May 2026. The report puts potential output at 3 billion litres a year from existing ethanol infrastructure and notes industry expectation of a 10 per cent blending requirement by the end of 2026.
What are India’s sustainable aviation fuel targets?
One per cent blending for international flights by 2027, 2 per cent by 2028 and 5 per cent by 2030, aligned to the CORSIA framework. Indian Oil Corporation received India’s first such certification in December 2025 and produces 30,000 tonnes of SAF a year at its Panipat refinery in Haryana, which is India’s entire current SAF capacity.
Can biofuels be imported into India?
No, not for blending. India prohibits imports of both fuel ethanol and biodiesel intended for blending with domestic fuel supplies. Ethanol imports for medical, industrial and beverage use continue and are forecast to fall to 560 million litres in 2026. Undenatured ethanol of 80 per cent strength or above carries a 150 per cent import duty.
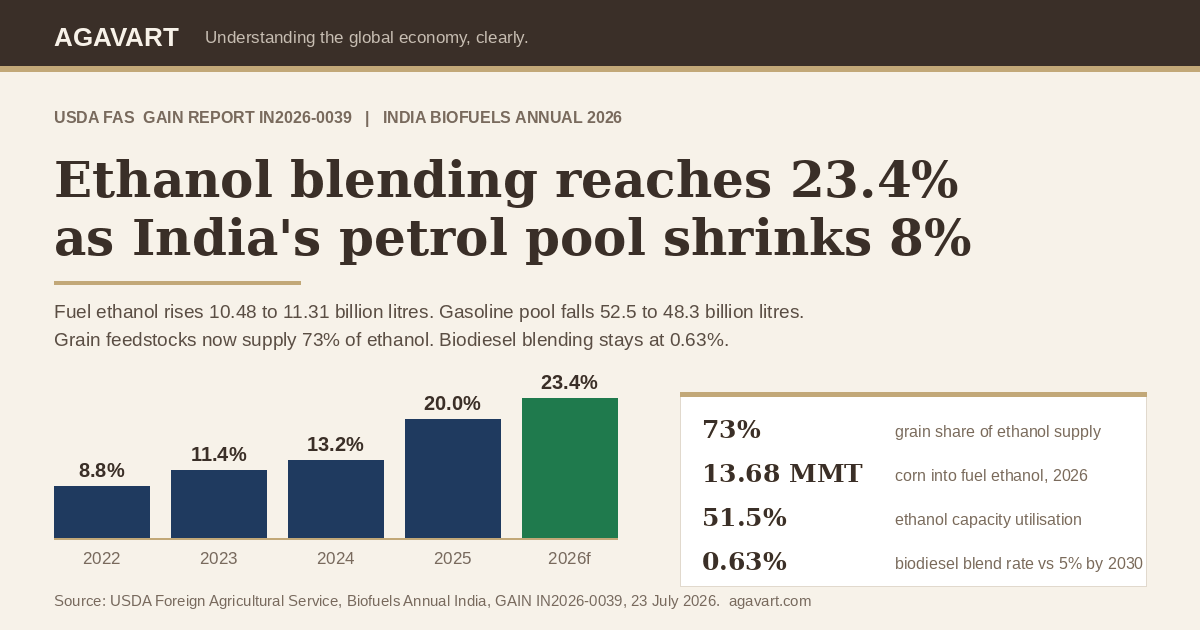
Visual summary of the India Biofuels Annual 2026 headline figures. Data: USDA FAS GAIN IN2026-0039.
Sources for the India Biofuels Annual 2026 data
- Biofuels Annual, India, USDA Foreign Agricultural Service, GAIN Report IN2026-0039, New Delhi, 23 July 2026. Every figure on this page is drawn from this report.
- Table sources cited inside the report: Ministry of Petroleum and Natural Gas and its Petroleum Planning and Analysis Cell (ethanol prices, gasoline and diesel pool data), Ministry of New and Renewable Energy (installed capacity and bioenergy), Central Board of Indirect Taxes and Customs (import duties), Department of Food and Public Distribution (budget allocations), and FAS New Delhi research.
- The report carries the standard GAIN notice that it contains assessments of commodity and trade issues made by USDA staff and is not necessarily a statement of official US government policy.
Cite this page: Agavart, “India Biofuels Annual 2026: ethanol blending reaches 23.4 per cent as the petrol pool shrinks”, 25 July 2026. Data from USDA FAS GAIN Report IN2026-0039.
Curated and Reviewed by Deepak Chavan | Founder & Market Expert