The Google ATLAS report 2026, formally titled AI & Economy ATLAS v1.0 and published on 23 July 2026, finds that AI usage now appears in 68 per cent of occupations worldwide, yet covers only 21 per cent of tasks in the median occupation that uses it. Over 86 per cent of conversational AI use happens outside formal work. Less than 10 per cent of AI conversations in non-routine cognitive work seek end-to-end automation. The study maps 15 million de-identified interactions across the Gemini App, Google AI Mode and the Gemini API.
Primary source: Google | AI & Economy ATLAS v1.0 | 23 July 2026 | Official report page
| The finding | AI has diffused across most of the economy, but workplace use remains shallow and largely collaborative; the bulk of usage happens outside formal work, as stated in the report. |
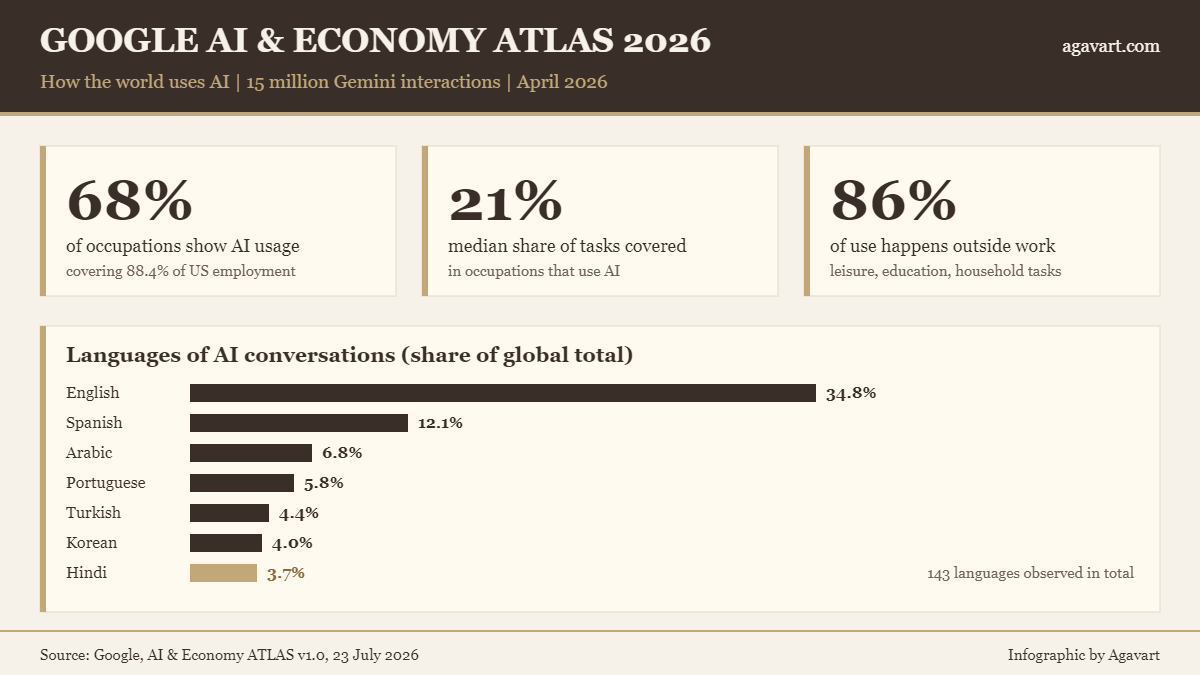
| By the numbers | 15 million interactions analysed; AI usage observed in 68% of detailed occupations, together covering 88.4% of US employment; median task saturation 21%; 86% of conversations outside work; English 34.8% and Hindi 3.7% of global conversations; 143 languages recorded. |
| Why it matters | As framed by the report, current AI acts mainly as a complement to human work, delivers household value that GDP metrics omit, and adoption tracks national wealth, which raises digital divide concerns. |
| Source | Google, AI & Economy ATLAS v1.0 (Activity, Task, Landscape, and Adoption Study), 23 July 2026. Original release. |
If you have a moment, read on for the full breakdown and sources
| Item | Detail |
|---|---|
| Sample | 14,653,926 de-identified interactions |
| Surfaces | Gemini App, Google AI Mode, Gemini API |
| Window | 6 April to 19 April 2026 |
| Coverage | 800+ occupations; 4,000 work tasks; 300 household activities; 150 countries; 143 languages |
| User base context | Google AI Mode over 1 billion monthly active users; Gemini App over 900 million (May 2026) |
| Exclusions | Paid enterprise Gemini API, Google Workspace, AI Overviews, Google Translate and other Google AI products |
| Measure | Figure, as stated in the report |
|---|---|
| Occupations with observed AI usage | 68% of detailed occupations |
| US employment those occupations represent | 88.4% |
| Median task saturation where AI is used | 21% of an occupation’s tasks |
| Occupations with over 75% of tasks saturated | 3% |
| Non-routine cognitive tasks: share of task universe vs share of AI interactions | 35% vs 65% |
| Automation intent in non-routine cognitive work | Less than 10% of conversations |
| Automation intent in routine cognitive work | 26.9% of conversations |
| Wage link | 1% higher median earnings is associated with a more than 2.5% rise in AI usage intensity |
| Median US salary, employment-weighted vs Gemini-conversation-weighted | $62,252 vs $82,919 |
| Activity (global share of conversations) | Share |
|---|---|
| Socialising, relaxing and leisure | 26.4% |
| Education | 20.7% |
| Work and work-related | 13.5% |
| Household activities | 11.0% |
| Personal care | 9.0% |
| Consumer purchases | 5.2% |
| Professional and personal care services | 4.8% |
| Travelling | 2.7% |
Government services and civic obligations are over-represented by a factor of almost twenty relative to time actually spent on them. Nearly half of medical, legal, financial and government AI consultations take place outside 9-to-5 business hours, as stated in the report.
| Measure | Figure, as stated in the report |
|---|---|
| Adoption vs national wealth | A 1% rise in GDP per capita is associated with a 0.9% rise in AI usage |
| Lowest-usage quintile of countries | 17% of world population, 2% of AI conversations |
| Top-usage quintile of countries | 11% of population, 30% of conversations |
| Top languages of AI conversations | English 34.8%; Spanish 12.1%; Arabic 6.8%; Portuguese 5.8%; Turkish 4.4%; Korean 4.0%; Hindi 3.7% |
| India’s position | Low tier for per-capita conversational AI use; Very High tier for AI search interest |
| Multimodal work use | Non-OECD countries generate images and videos for work at roughly twice the rate of advanced economies |
What the Google ATLAS report measured
ATLAS stands for Activity, Task, Landscape, and Adoption Study. It is Google’s first large scale economic study of its own AI usage data. The research team analysed 14,653,926 de-identified interactions recorded between 6 April and 19 April 2026 across the Gemini App, Google AI Mode and the Gemini API. Conversations were stripped of personal information, summarised, clustered, and then mapped to official statistical frameworks: US Bureau of Labor Statistics occupation codes, the Occupational Information Network task database and the American Time Use Survey. Any cluster representing fewer than 10 unique users was discarded.
Why the workplace numbers matter
The workplace picture is broad but thin. AI usage appears in 68 per cent of detailed occupations, and those occupations together cover 88.4 per cent of US employment. Yet in the median occupation with any observed use, only 21 per cent of tasks see meaningful AI activity. The report reads this as AI serving primarily as a complement to existing work rather than a replacement for it. Intent data points the same way: in non-routine cognitive work, less than 10 per cent of conversations seek end-to-end automation. Most usage sits in drafting, review and refinement, ideation and information retrieval. The report also documents a wage gradient. A 1 per cent rise in an occupation’s median earnings is associated with a more than 2.5 per cent rise in AI usage intensity, a pattern the authors connect to open questions on wage inequality.
The household economy that GDP does not count
More than 86 per cent of conversational AI use happens outside formal work. Leisure, education and household management dominate the mix. The heaviest over-representation sits in high-friction bureaucratic tasks: queries linked to government services and civic obligations run at almost twenty times their share of actual human time. The report attaches a conservative money value to this activity. If AI saved households an average of 30 minutes per week on productive tasks, the unpaid productivity gain in the US alone would be worth approximately $100 billion a year, valued at the official $12.02 per hour replacement wage. These gains are omitted from traditional GDP metrics, the report notes.
What to watch next
ATLAS is designed as an ongoing series. The first edition excludes paid enterprise API traffic, Google Workspace, AI Overviews and agentic workflows, so business adoption is under-represented by design; Google says future iterations will widen the scope. For Indian readers, the report leaves one clear number to track. India sits in the Low tier for per-capita conversational AI use but in the Very High tier for AI search interest, and Hindi already ranks seventh among global AI languages at 3.7 per cent of conversations. A Google and Ipsos survey cited in the report finds 80 per cent of Indian AI users already use the technology to assist with work. Whether that interest converts into measured adoption is the question the next edition will answer. Agavart’s earlier factsheet on the UN AI report 2026 and the rest of Agavart’s AI coverage track the same transformation from the policy side.
Frequently asked questions
- What is the Google ATLAS report?
- ATLAS (Activity, Task, Landscape, and Adoption Study) is Google’s economic research series on how people use its AI products. Version 1.0, published on 23 July 2026, maps 15 million de-identified Gemini interactions to occupations, tasks, household activities, countries and languages.
- Does the ATLAS report say AI is replacing jobs?
- No. The report states it found no evidence in its data that AI is about to cause massive automation of white-collar work. Usage is overwhelmingly collaborative: less than 10 per cent of conversations in non-routine cognitive work seek end-to-end automation. The authors caution these are early observations that could evolve as AI capabilities advance.
- Where does India stand in the Google ATLAS report 2026?
- India falls in the Low tier for per-capita conversational AI use but the Very High tier for AI search interest. Hindi is the seventh largest AI conversation language globally at 3.7 per cent. A Google and Ipsos survey cited in the report finds 80 per cent of Indian AI users employ it for work assistance.
- Where can I download the Google ATLAS report 2026 PDF?
- The full report, AI & Economy ATLAS v1.0, is available free on Google’s official announcement page, which links the complete PDF.
Landmark AI reports: original sources
AI Index Report 2026, Stanford HAI. Annual academic benchmark of AI progress covering technical performance, investment, policy and public opinion; widely used baseline for comparing AI capability and adoption trends. Original source.
International AI Safety Report. Independent scientific assessment of advanced AI capabilities and risks, chaired by Yoshua Bengio and backed by an international expert panel; the reference document for AI safety policy debates. Original source.
The State of AI: Global Survey 2025, McKinsey. Global survey of organisations on AI adoption, use cases and value capture; the standard enterprise-side counterpart to usage studies such as ATLAS. Original source.
Source
Google, AI & Economy ATLAS v1.0: Mapping Gemini Usage in the Economy, by Zanna Iscenko, Scott Strand and co-authors, Google and Google DeepMind, 23 July 2026. Official report page. All figures in this article are as published in the report.
Curated and Reviewed by Deepak Chavan | Founder & Market Expert