New ECB figures on AI-related goods trade contain a split that the debate on Europe and artificial intelligence has largely passed over. In core data centre goods the euro area is the weakest of the three major blocs, with imports growing 16.2 per cent across 2024 and 2025 against 55.7 per cent in the United States. In data centre infrastructure goods the ranking reverses: the euro area carries the largest share of the three blocs on both sides of its trade, and it grew that trade over the same two years while United States trade in the same goods contracted.
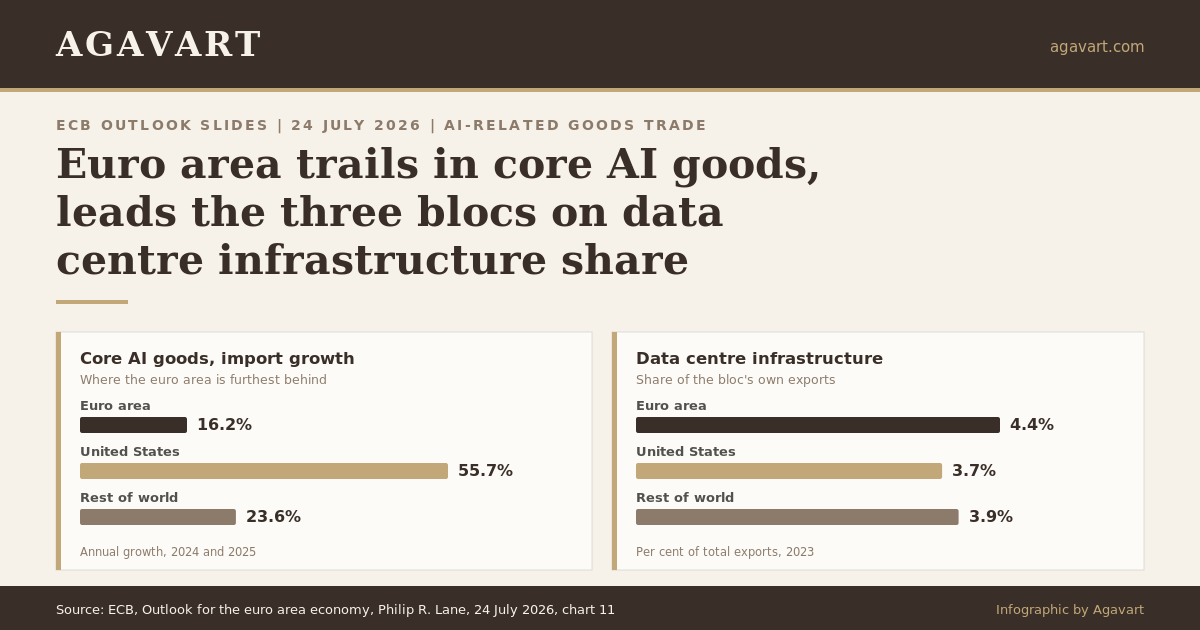
Shares are for 2023 and growth covers 2024 and 2025. EA is the euro area, US the United States, RoW the rest of the world excluding both.
United States
Rest of world
Annual growth in per cent. Data centre infrastructure is the only category where the euro area grew on both sides of its trade while the United States contracted on both. Source: ECB slide deck, 24 July 2026, chart 11, based on Emter et al. (2026) and Waugh (2026).
If you have a moment, read on for the full breakdown and sources
| Bloc | Share, exports | Share, imports | Growth, exports | Growth, imports |
|---|---|---|---|---|
| Total AI-related trade | ||||
| Euro area | 9.6 | 10.9 | 6.7 | 9.9 |
| United States | 12.5 | 12.3 | 11.5 | 34.6 |
| Rest of world | 14.4 | 14.1 | 19.4 | 16.8 |
| Core AI goods | ||||
| Euro area | 3.6 | 5.0 | 11.7 | 16.2 |
| United States | 6.6 | 7.1 | 22.4 | 55.7 |
| Rest of world | 8.7 | 8.1 | 26.0 | 23.6 |
| Data centre infrastructure goods | ||||
| Euro area | 4.4 | 4.7 | 4.5 | 5.4 |
| United States | 3.7 | 4.1 | -5.2 | -0.6 |
| Rest of world | 3.9 | 4.1 | 6.9 | 5.9 |
| Other AI-related goods | ||||
| Euro area | 1.6 | 1.1 | 2.6 | -1.8 |
| United States | 2.2 | 1.1 | -1.2 | -2.1 |
| Rest of world | 1.8 | 2.0 | 8.6 | 8.2 |
All figures in per cent. Shares are of the respective bloc’s own total exports or imports in 2023. Growth covers 2024 and 2025. Highlighted rows mark the two categories discussed in this factsheet. Source: ECB slide deck, 24 July 2026, chart 11.
What the AI-related goods trade data show
The ECB splits AI-related goods into four groups: core data centre goods, data centre infrastructure, upstream AI goods and broad industrial goods used in AI production, with the last two reported together as other AI-related goods. Read across all four, the euro area looks like a follower. Its total AI-related trade accounted for 9.6 per cent of exports and 10.9 per cent of imports in 2023, below both the United States and the rest of the world, and it grew more slowly than either over the following two years.
The category detail changes what that means. Core AI goods are where the gap is widest. The euro area’s core AI import share of 5.0 per cent in 2023 was the lowest of the three blocs, against 7.1 per cent in the United States and 8.1 per cent in the rest of the world, and its import growth of 16.2 per cent over 2024 and 2025 was under a third of the American figure of 55.7 per cent. On the export side the euro area grew 11.7 per cent against 22.4 per cent for the United States and 26.0 per cent for the rest of the world.
Where the ranking reverses
Data centre infrastructure goods behave differently. Here the euro area holds the largest share of the three blocs on both sides, 4.4 per cent of exports and 4.7 per cent of imports in 2023, ahead of 3.7 per cent and 4.1 per cent for the United States. It is also the only one of the four categories in which the euro area share exceeds both other blocs. Over 2024 and 2025 euro area infrastructure trade grew 4.5 per cent on exports and 5.4 per cent on imports, while American infrastructure trade fell 5.2 per cent and 0.6 per cent. The rest of the world grew 6.9 per cent and 5.9 per cent.
The fourth category of AI-related goods trade runs the other way again. In other AI-related goods the euro area and the United States both saw imports fall over 2024 and 2025, by 1.8 per cent and 2.1 per cent, while the rest of the world grew 8.2 per cent.
What the data do not say
A larger trade share is not a surplus. The ECB’s own Economic Bulletin states that the euro area is a net importer of the goods needed to build and run AI data centre infrastructure, and that this deficit widened from 0.2 per cent of GDP in 2024 to almost 0.3 per cent in 2025, partly on larger imports from China. The same box puts AI-related goods at about 13 per cent of euro area goods imports and about 9 per cent of exports in 2025, against the 2023 shares of 10.9 per cent and 9.6 per cent in the slide deck. Waugh (2026) separately estimates AI-related goods at 23 per cent of total United States goods imports in 2025, and the Central Bank of Ireland puts the Irish figure at 13 per cent. These estimates cover different years and slightly different aggregates and should not be netted against one another.
The classification itself is an estimate. Both the deck and the Bulletin identify AI-related goods by running product-level trade data through a large language model, following the method in Waugh (2026). No official trade nomenclature carries an AI category, so the boundaries of each group are a modelling choice, not a customs definition.
What to watch
Three things extend this AI-related goods trade series. First, whether the euro area’s infrastructure share holds once the 2026 data land, given that its import prices for AI-related goods have been rising while its import prices from China have been falling. Second, whether the American contraction in infrastructure goods was a single-cycle effect or the start of domestic substitution. Third, the publication of the underlying Emter et al. (2026) work, which would allow the category shares to be tracked past the 2023 base year on a consistent basis.
Frequently Asked Questions
What are AI-related goods in trade data?
For the purpose of measuring AI-related goods trade, the ECB groups them into core data centre goods, data centre infrastructure, upstream AI goods and broad industrial goods used in AI production. The first covers the computing hardware itself, the second the equipment that houses, powers and cools it. The classification follows Emter et al. (2026), who use a large language model following Waugh (2026), so it is a staff estimate rather than an official customs category.
How far behind is the euro area in core AI goods?
On the ECB figures, core AI goods were 5.0 per cent of euro area imports in 2023, the lowest of the three blocs, against 7.1 per cent for the United States and 8.1 per cent for the rest of the world. Euro area core AI imports then grew 16.2 per cent over 2024 and 2025, against 55.7 per cent in the United States and 23.6 per cent in the rest of the world.
Where does the euro area rank highest in AI-related goods trade?
In data centre infrastructure goods, on the AI-related goods trade shares the ECB publishes. These accounted for 4.4 per cent of euro area exports and 4.7 per cent of imports in 2023, the largest share of the three blocs on both sides. It is the only one of the four AI-related categories where the euro area share exceeds both the United States and the rest of the world.
Does that mean the euro area runs a surplus in AI infrastructure goods?
No. The ECB Economic Bulletin states that the euro area is a net importer of AI data centre infrastructure goods and that the deficit widened from 0.2 per cent of GDP in 2024 to almost 0.3 per cent in 2025, partly on larger imports from China.
Why did United States trade in AI infrastructure goods fall?
The slide deck reports the fall, of 5.2 per cent on exports and 0.6 per cent on imports over 2024 and 2025, without giving a cause. The deck contains no explanation of the contraction, so any reading of it is not supported by the published figures.
Sources
- European Central Bank, “Outlook for the euro area economy”, slides by Philip R. Lane, MacGill Summer School, Glenties, County Donegal, 24 July 2026, charts 10 and 11. ECB slide deck (PDF)
- Emter, L., Fidora, M., Pastoris, F. and Schmitz, M. (2026), “The narrowing of the euro area current account balance in 2025”, ECB Economic Bulletin, Issue 4, 2026. Read the box
- Waugh, M. E. (2026), “Trade in AI-Related Products”, NBER Working Paper No 35053, April 2026. NBER working paper
- Rice, J. and Scally, J. (2026), “AI-related imports, modified investment and the data centre build-out”, Central Bank of Ireland Quarterly Bulletin No 2, 2026. Central Bank of Ireland