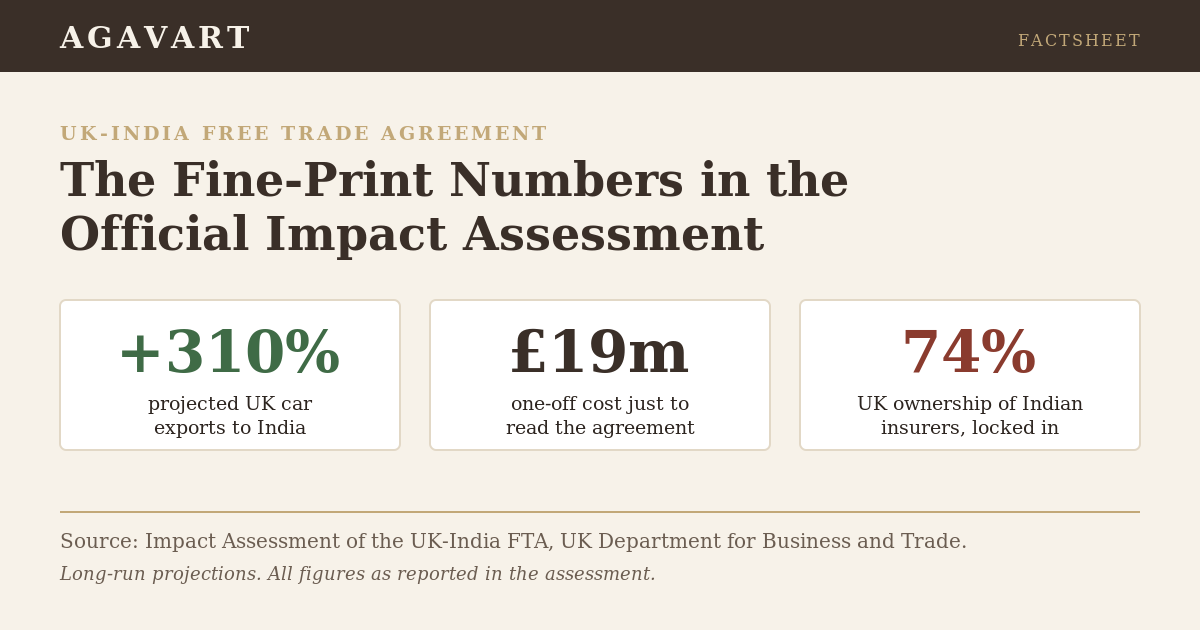
The UK government’s official UK-India FTA Impact Assessment (the Impact Assessment of the UK-India Free Trade Agreement) carries figures that sit well beneath the GDP headlines. It projects UK car exports to India rising 310 per cent, puts a 19.0 million pound one-off cost on UK firms simply reading the 170,000-word deal, and locks in UK ownership of Indian insurers at up to 74 per cent. This factsheet pulls the numbers most coverage skipped.
Reading the Fine Print of a 170,000-Word Deal
UK-India FTA: Tariffs and Trade Flows (long-run projections)
| UK motor vehicle exports to India | +£890 millionequivalent to a 310% increase; tariffs on completed vehicles fall from as high as 110% to 10% within a quota |
|---|---|
| UK beverage and tobacco exports (includes whiskies) | +£700 millionequivalent to a 180% increase |
| Total UK exports to India | +£12.4bn to £19.4bna rise of nearly 60% (47% to 73.5%) in the long run |
| UK imports from India | +£9.8 billiona rise of about 25% in the long run |
| Bilateral trade, long run | +£25.5 billion a yearan increase of nearly 39% |
Business Costs and Customs
| One-off familiarisation cost for UK business | £19.0 millionrange £18.3m to £20.0m; reflects staff time to read and understand the agreement, estimated at about 170,000 words |
|---|---|
| UK SMEs already exporting goods to India (2023) | about 7,800set to see reduced administrative costs |
| Release of goods from customs | within 48 hoursboth sides to endeavour to release goods from customs control within 48 hours of arrival where requirements are met |
Market Access Firsts for UK Firms
| Indian government procurement | “Class 2” status at 20% UK contentUK firms treated as class 2 suppliers under Make in India if at least 20% of the product or service is from the UK, a status previously reserved for Indian firms; class 1 preference still applies at 50% or more Indian content |
|---|---|
| UK ownership of Indian insurance and banking firms | locked in up to 74%FDI ownership commitment fixed by treaty against future reversal |
| Source code | protectedneither side may require transfer of, or access to, proprietary source code as a condition of market access |
| Dedicated chapters | gender equality, development, SOEsthe assessment confirms dedicated chapters on gender equality, development and State-Owned Enterprises |
Environment and Excluded Sectors
| UK greenhouse gas emissions | +0.8 MtCO2ea 0.21% rise against a 2019 baseline of 393.5 MtCO2e, driven by higher industrial activity |
|---|---|
| Carbon leakage risk sector | Textiles, apparel and leatherIndian output in this sector is more emissions-intensive at 578 tCO2e per USD million against the UK’s 134 tCO2e |
| UK sensitive products kept out of liberalisation | Milled rice, sugar, pork, chicken, eggsIndia retains protection on items such as dairy, tobacco and certain edibles |
Summary
The headline case for the UK-India FTA is familiar: the deal is projected to lift UK GDP by 0.13 per cent, worth 4.8 billion pounds a year in the long run, and India’s GDP by 0.06 per cent, worth 5.1 billion pounds a year. The official Impact Assessment behind those numbers, however, sets out a far more specific picture of who gains, at what cost, and where the deal deliberately holds back.
The sharpest single figure is on cars. Tariffs on completed UK motor vehicles, currently as high as 110 per cent, fall to 10 per cent within a quota, and the assessment estimates UK motor vehicle exports rising by 890 million pounds, equivalent to a 310 per cent increase. Whiskies sit inside a beverage and tobacco category projected to grow exports by 700 million pounds, or 180 per cent. Across all sectors, UK exports to India are modelled to rise by nearly 60 per cent in the long run, a range of 12.4 billion to 19.4 billion pounds, lifting bilateral trade by around 25.5 billion pounds a year.
The assessment is unusually candid about the cost of complexity. It puts a one-off familiarisation cost of 19.0 million pounds on UK business, essentially the staff time needed to read and absorb an agreement it estimates at roughly 170,000 words. It also identifies about 7,800 UK small and medium enterprises already exporting to India that stand to see lower administrative costs, and records a commitment for both sides to endeavour to clear goods from customs within 48 hours of arrival.
Several provisions mark a shift in market access. For the first time UK companies can be treated as class 2 suppliers under India’s Make in India procurement policy if at least 20 per cent of their product or service is from the UK, a status previously open only to Indian firms. UK ownership of Indian insurance and banking entities is locked in at up to 74 per cent, giving a treaty-backed guarantee against future policy reversal. On digital trade, neither side may demand access to a business’s proprietary source code as a condition of entering the market. The assessment also confirms dedicated chapters on gender equality, development and State-Owned Enterprises.
The document does not present the UK-India FTA as costless or comprehensive. It estimates that the agreement raises UK greenhouse gas emissions by around 0.8 million tonnes of CO2 equivalent, a 0.21 per cent rise against a 2019 baseline, and flags a carbon leakage risk in textiles, apparel and leather, where Indian production is more emissions-intensive at 578 tonnes of CO2 equivalent per million US dollars against the UK’s 134. And it is explicit that sensitive UK farm products including milled rice, sugar, pork, chicken and eggs are kept out of liberalisation, while a separate Double Contributions Convention on social security was negotiated as a standalone treaty rather than folded into the FTA.
Outlook: What the Assessment Projects for the Long Run
The document defines the long run as roughly 10 to 15 years after implementation. All figures below are as modelled in the Impact Assessment, relative to a baseline of no agreement.
| Indicator | Projected change | Direction |
|---|---|---|
| UK GDP | +£4.8bn/yr (0.13%) | Rising |
| India GDP | +£5.1bn/yr (0.06%) | Rising |
| Bilateral trade | +£25.5bn/yr (39%) | Rising |
| UK exports to India | +£12.4bn to £19.4bn | Rising ~60% |
| UK motor vehicle exports | +£890m (310%) | Rising |
| UK GHG emissions | +0.8 MtCO2e (0.21%) | Rising |
What next: The assessment stresses that long-run modelling of any FTA carries significant uncertainty, and singles out the motor vehicle sector as the least certain given how the quota and domestic production develop. The Office for Budget Responsibility will certify the fiscal impact of the FTA, including the Double Contributions Convention, in the usual way.
“UK motor vehicle exports are estimated to increase by 890 million pounds, equivalent to a 310 per cent growth.”UK-India FTA Impact Assessment
Does the 310 per cent car export figure mean tariffs are zero?
No. The assessment states tariffs on completed UK motor vehicles fall from as high as 110 per cent to 10 per cent, and only within a quota, not to zero.
What is the 19 million pound cost?
It is a one-off familiarisation cost on UK business, the estimated staff time and expense of reading and understanding the agreement, which the document estimates at about 170,000 words. The central estimate is 19.0 million pounds, in a range of 18.3 million to 20.0 million.
Which UK farm products are excluded?
The assessment names milled rice, sugar, pork, chicken and eggs as sensitive UK products kept out of tariff liberalisation.
Source: Impact Assessment of the Free Trade Agreement between the UK and India, UK Department for Business and Trade. Read the full document: Impact Assessment PDF. Entry into force confirmed via GOV.UK.