The newly released USDA Planted Acreage and Grain Stocks reports outline a comfortable immediate supply cushion, characterised by expanded soybean planting and stable corn acreage. However, this near-term relief for buyers is actively challenged by a strengthening El Niño event confirmed by global meteorological agencies. This creates a delicate balance for agricultural markets, positioning current physical abundance against looming climate risks, and warning market participants against premature market optimism or panic.
For agricultural producers, traders and policy makers, these reports provide the definitive supply baseline for the 2026 season. Understanding the interaction between these high planting figures and the active climate wildcard is essential for navigating the volatile market trends ahead.
Table of Contents
| Crop | Planted acreage, 2026 | Change from 2025 |
|---|---|---|
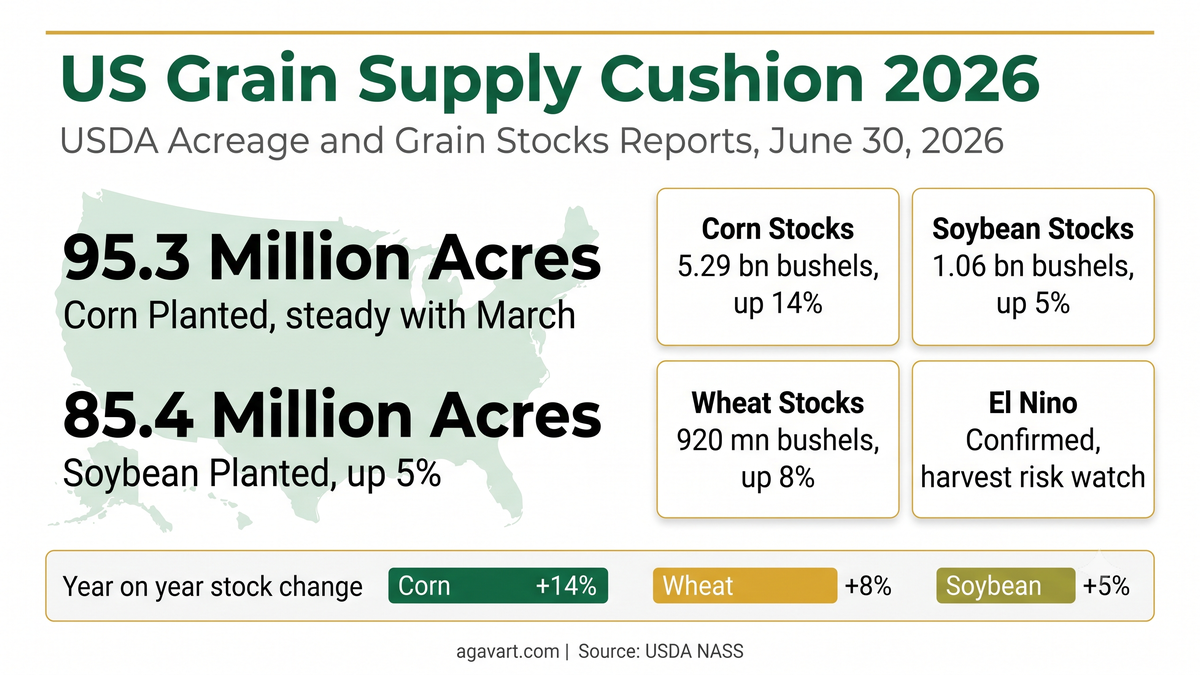
| Corn | 95.3 million acres | down 3 per cent |
| Soybean | 85.4 million acres | up 5 per cent |
| All wheat | 42.7 million acres | down 6 per cent |
| All cotton | 9.85 million acres | up 6 per cent |
| Crop | Stocks, June 1, 2026 | Year on year change |
|---|---|---|
| Corn | 5.29 billion bushels | up 14 per cent |
| Soybean | 1.06 billion bushels | up 5 per cent |
| Wheat | 920 million bushels | up 8 per cent |
Planted Acreage Trends for 2026
Corn planted area for 2026 is estimated at 95.3 million acres, unchanged from the prospective plantings estimate released on March 31. This is a 3 per cent decline from the acreage planted in 2025.
In contrast, soybean planted area expanded to 85.4 million acres, marking a 5 per cent increase from 2025. This figure is also higher than the March prospective plantings estimate of 84.7 million acres. The expansion reflects a clear shift toward soybeans, driven by a favourable soybean-to-corn price ratio during the spring planting window and a desire among producers to manage nitrogen fertiliser costs.
For other major crops, all wheat planted area for 2026 is estimated at 42.7 million acres, representing a 6 per cent decline from 2025. All cotton planted area is estimated at 9.85 million acres, up 6 per cent from the previous year.
Quarterly Grain Stocks Analysis
The quarterly stocks report provides a measure of crop inventories remaining in all positions, both on-farm and off-farm, as of June 1, 2026.
Corn stocks in all positions totalled 5.29 billion bushels, representing a 14 per cent increase from the 4.64 billion bushels held on June 1, 2025. While this confirms a substantial year-on-year rebuilding of corn inventories, the figure was slightly below the average trade estimate of 5.39 billion bushels. This lower-than-expected inventory provided a brief bullish check on the market, offsetting the bearish pressure of the high acreage print.
Soybean stocks in all positions totalled 1.06 billion bushels, up 5 per cent from June 1, 2025. This quarterly inventory represents a six-year high for June stocks, crossing the critical one billion bushel threshold and confirming comfortable domestic supplies.
Old crop all wheat stocks on June 1, 2026, totalled 920 million bushels, up 8 per cent from the previous year, with on-farm stocks rising by 12 per cent.
The El Niño Climate Wildcard
While the USDA reports establish a comfortable baseline of physical supply, global meteorology introduces a major uncertainty. The Australian Bureau of Meteorology confirms that El Nino is active, with the Nino3.4 index at 1.24 degrees Celsius for the week ending 28 June 2026, and forecasts point to a strong to very strong event.
In previous El Niño events, a strong episode during the Northern Hemisphere summer has brought high heat and dry conditions to key crop-producing regions, particularly the US Midwest, eastern Australia and parts of Southeast Asia.
Therefore, although the current planted acreage is high, the final crop yields remain highly volatile. If the active El Niño triggers mid-summer heatwaves in the US grain belt during critical pollination phases in July and August, the current inventory cushion could quickly erode, leading to a sharp reversal in global crop prices.
Implications for Global Trade and Developed Markets
The combination of stable corn planting and expanded soybean acreage ensures that global supply baselines remain highly comfortable, putting pressure on major commodity exchanges. For developed economies, particularly the United States and the European Union, this supply comfort has direct strategic implications:
- Relief for the livestock and dairy sectors: Lower international corn and soybean prices will significantly reduce feed costs for livestock, poultry and dairy producers in the US and Europe, improving processing margins after years of inflationary pressure.
- Biofuel feedstock economics: Soybean oil and corn are primary feedstocks for biodiesel and ethanol production in developed markets. Comfortable supplies will lower feedstock costs, potentially improving the margins of green energy refiners operating under strict government blending mandates.
- Global export competition: An expanded US crop increases competition with South American exporters, particularly Brazil and Argentina. This supply abundance may lead to aggressive export pricing, impacting trade flows to major importing hubs in East Asia.
Strategic Outlook
The USDA data suggests that the agricultural markets are entering a phase of supply comfort, putting a cap on immediate prices. However, the confirmed development of a strong El Niño remains the ultimate wildcard. While the current acreage baseline is high, actual production is not guaranteed. Traders and processors are keeping a close watch on ocean temperature anomalies alongside crop condition reports.
FAQ
What are the key findings of the USDA June 2026 Acreage report?
The report states that US corn acreage remains stable at 95.3 million acres, matching March expectations, while soybean acreage has expanded to 85.4 million acres, up 5 per cent from 2025.
How do current grain stocks compare to last year?
Both corn and soybean stocks are higher. Corn stocks rose 14 per cent to 5.29 billion bushels, and soybean stocks rose 5 per cent to 1.06 billion bushels, marking a six-year high for June soybean inventories.
Why is the active El Niño considered a market wildcard?
Although planting acreage and stocks are high, El Niño brings risks of severe summer heat and drought to key growing regions in the US and Australia. If yields are affected, actual supplies could drop sharply later in the season.
How does the global USDA report affect developed market industries?
It provides significant cost relief for the livestock sector by lowering animal feed costs, improves feedstock economics for the biofuel and ethanol industries, and intensifies export competition between the US and South America.
Parallel Reading
To understand the broader global context of food supplies, the Food and Agriculture Organisation (FAO) Food Outlook provides a comprehensive overview of global production, trade and price trends across major food commodities. FAO Food Outlook Report Agavart has also covered the FAO Food Outlook and El Nino risk to harvests, and the geopolitics of grain trade in the U.S.-Iran dispute, both relevant to this supply picture.
Primary Reports and Sources
- USDA Acreage Report (June 30, 2026): esmis.nal.usda.gov
- USDA Grain Stocks Report (June 30, 2026): esmis.nal.usda.gov
- Australian Bureau of Meteorology (BOM) Climate Update: bom.gov.au, ENSO Wrap-Up (updated regularly)
Curated and Reviewed by Deepak Chavan | Founder & Market Expert