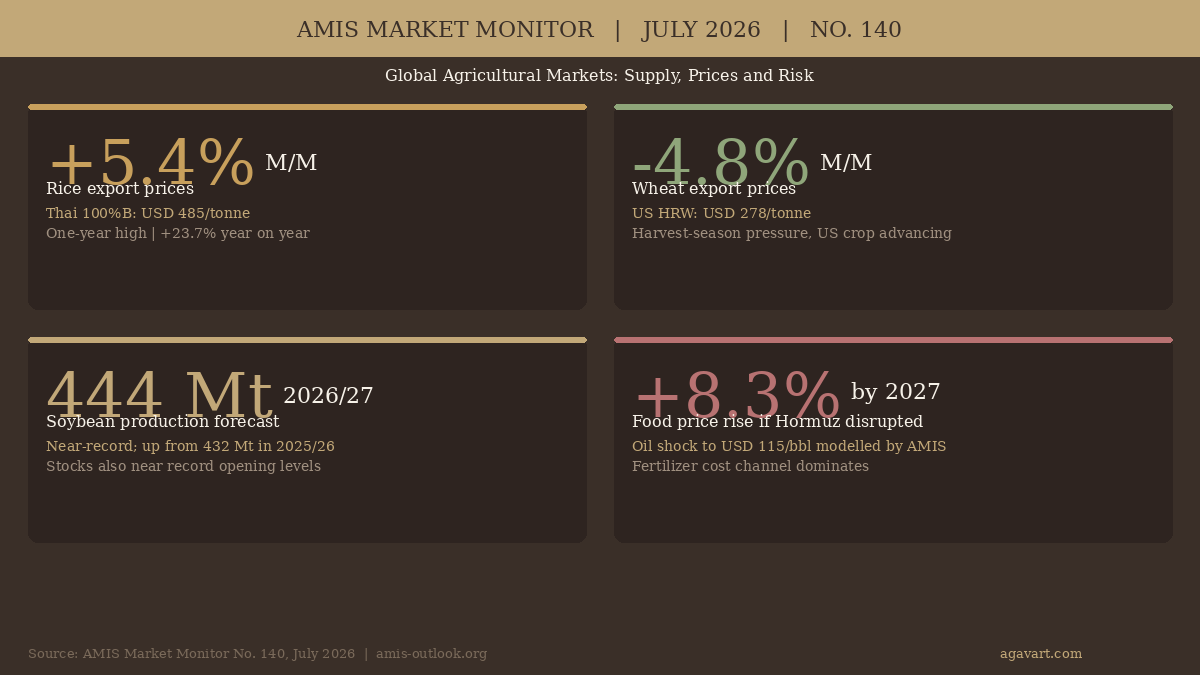
Rice export prices climbed to a one-year high in June 2026, rising 5.4 percent to USD 485 per tonne for Thai 100%B, as El Nino concerns build across key growing regions. Wheat moved in the opposite direction, falling 4.8 percent under harvest-season pressure from the advancing US crop. AMIS Market Monitor July 2026 (No. 140) frames this price divergence against a broadly steady but uneven supply outlook, with soybeans tracking toward a near-record 444 million tonne harvest and a Strait of Hormuz oil shock flagged as the headline downside risk for 2027.
Primary Source
AMIS Market Monitor No. 140, July 2026
Agricultural Market Information System (G20/FAO/OECD/WFP)
amis-outlook.org/market-monitor
AMIS Market Monitor July 2026: Key Findings
This AMIS Market Monitor July 2026 edition covers supply and demand, price movements, geopolitical risk and policy for wheat, maize, rice and soybeans. The rice price rise echoes concerns flagged in the NOAA El Nino Advisory July 2026; for the broader food price context, see the FAO Food Price Index June 2026. The IMF also flagged the Hormuz risk for global growth in its July 2026 World Economic Outlook Update.
The report covers the four AMIS crops (wheat, maize, rice and soybeans) across supply, demand, prices, fertilizer markets and ocean freight. Read on for the full breakdown.
Read More: Supply, Prices, Risk and Policy
The Supply Picture
Global wheat output for 2026/27 is forecast at 810.9 million tonnes, down from around 844 million tonnes the prior season, reflecting expected contractions mainly in Australia. Maize production is projected at 1,310.7 million tonnes, slightly below the 2025/26 record, though trade volumes are expected to reach record levels. Rice production is seen at 552.4 million tonnes, around 10 million tonnes below 2025/26, with global rice stocks falling 2.7 percent from their record high as utilisation peaks.
Soybeans are the outlier. The 2026/27 crop is forecast at 444.2 million tonnes, well above the prior year’s 432.3 million tonnes and approaching the crop’s all-time record. Opening stocks are also near record levels, giving the oilseed complex considerably more cushion than wheat or rice this season.
Price Movements: Rice Rises, the Rest Retreats
Using the IGC Grains and Oilseeds Index (GOI) as a reference, the overall index stood at 224.2 at end-June, down 2.8 percent from May but 4.9 percent above year-ago levels. The underlying moves were sharply uneven. Rice was the only major crop to gain on the month, with the GOI rice sub-index up 3.3 percent to 175.8, its highest reading in more than a year. El Nino concerns in Southeast Asia and the timing of new-crop arrivals were cited in the report.
On export market benchmarks, Thai 100%B rice reached USD 485 per tonne (+5.4 percent month-on-month, +23.7 percent year-on-year). The other crops moved lower: US HRW wheat fell to USD 278 per tonne (-4.8 percent M/M, +21.9 percent Y/Y), US No.2 Yellow maize to USD 195 per tonne (-5.2 percent M/M), and US No.2 Yellow soybeans to USD 449 per tonne (-5.1 percent M/M, +10.6 percent Y/Y). The soybean year-on-year gain reflects a tight 2025/26 carryover.
The Hormuz Risk Model
AMIS Market Monitor No. 140 devotes its feature article to a quantitative assessment of a Strait of Hormuz disruption scenario. If crude oil were to reach USD 115 per barrel (53 percent above the report’s baseline), the model estimates global agricultural commodity prices would rise 4.5 percent in 2026 and 8.3 percent in 2027 through fertilizer cost and biofuel demand channels. The fertilizer cost pathway accounts for the majority of the transmission; biofuel demand effects contribute a further 1.6 percentage points.
The model also identifies differential country impacts. South Africa’s cereal output is projected to fall about 5 percent below the baseline in both 2026 and 2027. Turkey and Thailand each see production declines of around 3 percent in 2026, while India’s cereal output would be approximately 2 percent below baseline. The report notes that recovery is expected from 2028 onward if the shock is temporary. The Strait of Hormuz remains the critical variable; fertilizer flows through the waterway had already picked up considerably following the Iran-US memorandum of understanding signed in June 2026.
Fertilizer Markets: Supply Easing, Affordability Still Stretched
Urea prices fell sharply in June. India’s most recent procurement tender attracted offers exceeding 6 million tonnes against a requested 1.7 million tonnes, pushing prices below USD 450 per tonne CFR and signalling ample supplier capacity. China resumed exports as anticipated. Phosphate and potash prices were broadly stable compared to May.
Despite the cost relief, the AMIS fertilizer cost index for wheat in the European Union remains at a 3.5-year high, meaning affordability for European growers is still historically weak. In the United States, maize fertilizer costs dropped around 30 percentage points from end-May, returning to levels last seen in February 2026. Natural gas prices held firm in the US on high cooling demand, while in Europe they declined after Near East supply risk eased.
Policy Landscape
Several trade and support measures were announced or clarified across AMIS member countries during the period:
- Turkey: the TMO set wheat procurement at TRY 16,500 per tonne (approximately USD 450), providing a floor for domestic producers.
- Kazakhstan: a proposed 6-month wheat import ban is under discussion.
- EU: approved a EUR 540 million farm support package including a EUR 300 million fertilizer crisis reserve; new genomic techniques (NGT) rules also passed.
- Argentina: gradual reductions in export duties on soybeans, soy by-products and maize planned from January 2027 through December 2028.
- Indonesia: rice food aid extended, a 250,000-tonne soybean subsidy announced, and palm oil export centralisation measures confirmed.
- Viet Nam: E10 ethanol-blended petrol launched nationwide.
- India: excise duty exemption extended to 22-30 percent ethanol blends.
- Russia: vegetable oil import duties raised to 35 percent.
- US: phosphate imports from Morocco temporarily exempt from tariff measures.
Ocean Freight
The Baltic Dry Index closed June 2026 at 2,524, down 21.7 percent on the month but still 69.5 percent above June 2025. Smaller vessel segments outperformed larger bulkers: Supramax rates rose 6.4 percent on Atlantic activity while Panamax fell 9.9 percent on slack demand and rising vessel supply in Asia. The IGC Grains and Oilseeds Freight Index was essentially flat at 177.5 (-0.2 percent M/M), though 23.8 percent above year-ago levels. The anticipated resumption of traffic through the Strait of Hormuz is the key variable the report flags for bulk shipping heading into July.
What to Watch
The AMIS summary identifies El Nino’s emergence as the main forward risk for rice and tropical crops in the second half of 2026. The pace of Australia’s and the Northern Hemisphere’s wheat harvests will shape the next revision to the wheat supply balance. Argentina’s soybean export duty trajectory and Indonesia’s palm oil policy remain active variables on the policy side. The fertilizer market’s key watch-point is further developments in Hormuz traffic and their effect on nitrogen supply flows.
Frequently Asked Questions
What is the AMIS Market Monitor?
The Agricultural Market Information System (AMIS) is a G20-mandated initiative that publishes a monthly assessment of global markets for wheat, maize, rice and soybeans. The monitor draws on data from FAO, OECD, WFP and member governments and is freely available at amis-outlook.org.
Why is rice rising while wheat is falling?
AMIS attributes the rice price rise to El Nino concerns affecting growing seasons in Southeast Asia and to the transition period before new-crop supplies arrive. Wheat is under seasonal harvest pressure, with the US crop advancing faster than average, bringing additional supply to export channels, while geopolitical tensions that had supported prices have also eased.
How severe would a Hormuz disruption be for food prices?
The AMIS model uses a scenario where crude oil reaches USD 115 per barrel, 53 percent above the baseline. Agricultural commodity prices would rise 4.5 percent in 2026 and 8.3 percent in 2027 under that assumption. The dominant transmission route is fertilizer costs, not direct energy use in food production. Countries reliant on imported fertilizers and net food importers face the largest exposure.
Sources: AMIS Market Monitor No. 140, July 2026 (amis-outlook.org). IGC Grains and Oilseeds Index, end-June 2026.
Curated and Reviewed by Deepak Chavan | Founder & Market Expert